SonarTRX Tutorials and PlusPack use cases
Tutorial: Video - Installation of SonarTRX and licensing system [5-6 minutes ...showing the steps involved]
SonarTRX YouTube Video - Installation
This is a video tutorial about how to install SonarTRX and its licensing system on a computer. The video also explains how to generate the required "Client to Vendor" file (*.C2V) that must be submitted to SonarTRX support via email, in order to receive the final license.
Tutorial: Video - SonarTRX Basic Use
SonarTRX YouTube Video- Basic Use
This video shows use of SonarTRX to generate side scan sonar images for display in Google Earth Pro - the desktop version. The sonar-data could come from a Garmin, Humminbird, Lowrance or other supported sonar type. The video shows import of portions of a sonar recording (i.e. a SonarTRX "Clip"), followed by a quick preview with the SonarTRX viewer, where we measure the width of a sand-channel, the height of a feature and define an additional Clip for just the sand channel. Finally, the video shows the process of generating a KML file for displaying images in Google Earth - the desktop version.
Tutorial 2: Processing of data from a fish-finder
The process of creating images for Google Earth Pro consists of a few easy steps:
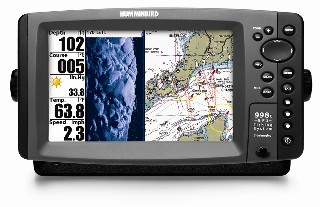 1. Use your Garmin, Lowrance, Humminbird or other compatible sonar to make recordings. |
 2. Transfer the data files to your PC for backup and/or processing. |
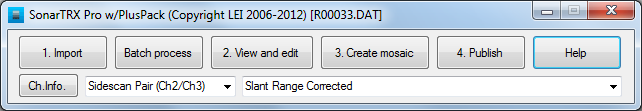 3. Use SonarTRX to view the data and generate geo-referenced images. |
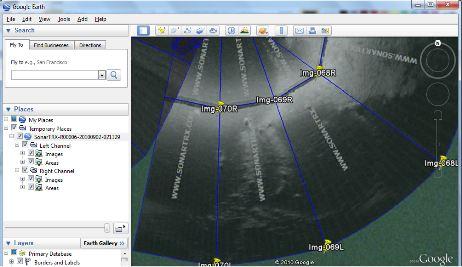 4. View the resulting sonar images with Google Earth - the desktop version, or import to your Geographic Information System (GIS). Optionally: Within Google Earth - desktop, annotate with points and lines, and save back to KML. |
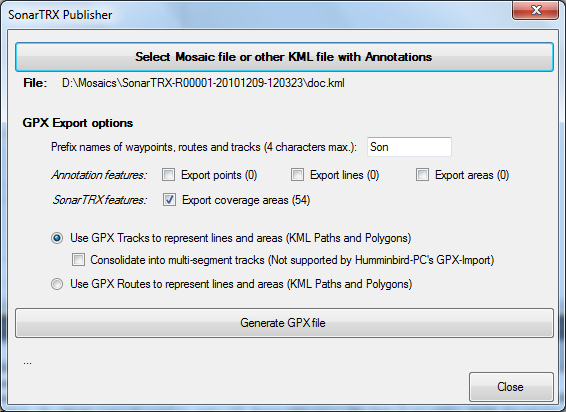 5. Use the SonarTRX Publisher to convert vector-features (points/lines/...) from the KML file to GPX, for import and display on sonar/chart-plotter: |
| 6. Use your sonars utility software (Example: Humminbird-PC) to import your GPX features back to the SD-Memory card for display on the sonar. |
PlusPack Usage Scenarios
Example-1 (RTK GPS positions and elevations): A sidescan survey was carried out with a Humminbird Side Imaging sonar with a built-in GPS. However, precise RTK GPS data was also logged separately, including absolute elevations of the GPS antenna. A logfile (simple csv file) was generated with time-stamped RTK GPS positions and the antenna elevations. This file was loaded as "alternate data" (in this case position and elevations) in SonarTRX after first loading the actual sonar data from the Humminbird Recording. The height of the antenna and the depth of the transducer were also specified in the SonarTRX advanced settings dialog. Having loaded the alternate data and configured the vertical offsets, the Export XYZ feature was used to generate an XYZ file containing positions and absolute elevations of both the seabed and the water surface. This information was then used for gridding and contouring by a 3'rd party GIS tool to produce absolute elevation grids & contour lines of the survey area.
Example-2 (Other tracking system in use): A sidescan survey was done with a towfish (or AUV), but the sonar recording did not include any valid positions. However, another tracking system (hydrodynamic, inertial and/or acoustics-based) was used to determine the position of the towfish (or AUV), and post-processing of that tracking data produced a final time-stamped list of positions of the towfish (or AUV) for the entire survey. This file was then used as "alternate data" and loaded into SonarTRX after first loading the actual sonar data. A new set of Geo-referenced sidescan images could then be produced, using the correct transducer positions.
Example-3: (Separate altimeter in use): Survey data from a towfish was logged to an XTF file, but the altitude was logged separately with data from an altimeter on the towfish. The altitude data w/time-stamps were then loaded as "alternate data" into SonarTRX after first loading the sidescan sonar data in the XTF file. Slant-range corrected images could then be generated by SonarTRX, based on the altimeter data.
Example-4 (Bottom roughness/rugosity): SonarTRX Pro can be used to estimate the depth based on the first echo return from the side scan channels instead of the depth from the down-imaging transducer. The resulting depth profile may have a much higher level of detail than the depth available in the original recording: The wider angle down-facing transducers produce a smoother, but less accurate depth profile as compared to the narrow beam (front-to-back) sidescan transducers. These detailed depth profiles can be used to calculate metrics about the seabed such as rugosity (bottom roughness) etc. They can also be used for pipeline design purposes, estimates of span lengths etc. By exporting XYZ data from the first echo return calculations, in a projected coordinate system, simple spreadsheet tools can be used to calculate bottom roughness along the line of the survey.